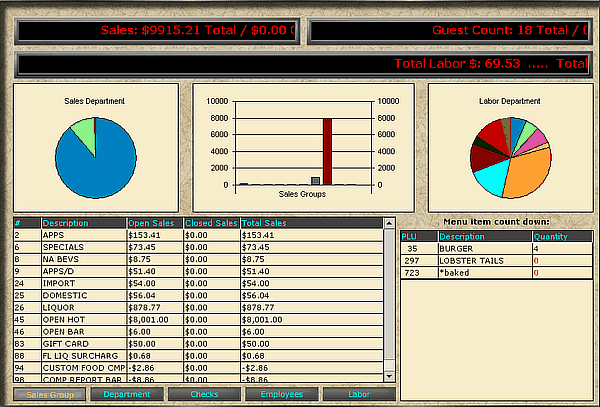
This will display up to the second stats on sales, labor, and checks.

The top left scrolling bar will display total sales and then break it down into closed check sales and open check sales. It will also display the total labor percentage.
The top right scrolling bar will display check and guest totals, including open check and closed check totals and averages.
The lower scrolling bar will display all job codes clocked in for the day, their total pay, how many hours worked and the percentage of total labor that job code accounts for. It will also display the total labor payed out and the total number of hours worked for all job codes.
The left pie chart will display the sales groups. By double clicking the picture you can view the legend.
The middle bar chart will show the sales groups. The numbers to the side represent whole dollars. Double clicking the chart will reveal the legend.
The right pie chart will display the job codes. double clicking the chart will reveal the legend.
The lower left box will display information depending on which choice is chosen below. Choose from sales groups, department groups, checks, employees, and labor.
Sales groups- Shows open sales, closed sales and total sales for each sales group.
Department groups- Shows open sales, closed sales and total sales for each department.
Checks- Shows detailed information about all open checks.
Employees- Show an employees sales, Check average, guest average and number of tables.
Labor- Shows labor hours,total dollars and percent of sales by job codes.
The lower right box will display the countdown items selected during the initial Product Items setup (found in the Evaluators section. This will show the item, its Product Items number and how many are still available.
NOTE: Hovering the mouse over a check will show all the specific details for the check.