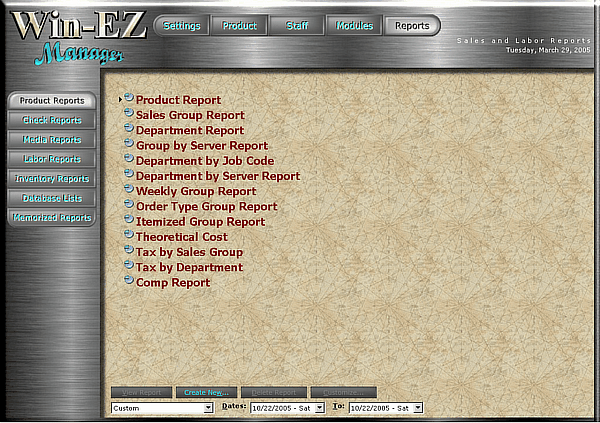
Win-EZ Manager breaks reports down to different sections depending on the information needed. There are 7 sections (including Inventory) with numerous reports in each sections. Within each report, the system will allow for "advanced-custom" reporting.

If Win-EZ Manager is started prior to someone clocking in or before a sale is closed for the first time the current date will not be displayed in the list of available reports. To reset close and restart Win-EZ Manager.
Product Reports: View reports on Sales, departments, taxes, itemized reports and comps.
Check Reports: View reports on closed checks.
Media Reports: View reports on Media.
Labor Reports: View reporting on employee labor, tips and payroll.
Inventory Reports: View reports on inventory, counts, cost and invoices.
Database Lists: View database lists of products, Modifier database and employee database.
Memorized Reports: View reports that are custom made from the reports above.
The Different Ways To Set Up Reports
![]()
The left pull down is to set up what dates the report will show. The custom choice makes available the dates in the center and the right. Set the start date and end date to which ever days the report is needed.
Use the left pull down it will give more options: Report default date-????????, Today, Yesterday, Current Month, Current Year, Previous Month, Previous Year, Last 7 Days, Last 30 Days, Last 3 Months, Last 6 Months, Last 12 Months, Week Ending <date>, Month Ending <date>, Year Ending <date>.
![]()
Once the report is selected press "View" Report - which will create the report and change to the view report screen.
Create a New... which will create a report based on what setting that is designated. Delete Report - only available in the Memorized Report section. Customizing a report will create a new, user defined report with a multitude of specific choices.
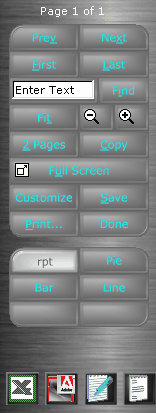
The Reports Control Panel

Prev & Next: If a multiple page report, use these to move between pages.
First: This will go to the first page of the report.
Last: This will go to the last page of the report.
Enter Text Box & Find: Type a word in the white box and click find to be taken to the first one in the report. Click it again and it will advance to the next word. And so on.
Fit: This will resize the report to fit the screen, width wise.
- & + magnifiers: zoom in and out on the current menu.
2 Pages: Used to view 2 pages laying next to one another. When clicked the button will change to "1 Page", click this to return to the original format.
Copy: Use this to make a copy of the menu (like the right click and copy function) and then go to another program (exp. paint or word) and from there right click and select paste. This will move the menu to another program for more customized work.
Full Screen: This will resize the report to fit in the entire screen getting rid of the control panel on the left and moving it to the top of the screen.
Customize:
Save:
Print...: This will send the report on the screen to your report printer. This will also print your pie and chart reports.
Done: This will bring you back to the main report page
rpt: Shows the report being viewed.
Pie: Shows the report in a pie chart. Clicking the pie button again will change the colors of the pie chart. The bottom two buttons offer different views of the pie chart. The left button scrolls form smooth, 2D, 3D, and Taurus. While viewing the pie chart, click and hold on the screen to move the pie chart around. Turning it and making it bigger or smaller. The chart on the right shows a list of the items in the report, then corresponding color, and the sales amount.
Bar: Shows the report in a bar chart. Clicking the bar button again will change the colors of the bars. The bottom left button will change the bar graphics from smooth, gem, 3D, cylinder, cone, inverted cone, pyramid, and inverted pyramid. While viewing the bar chart, click and hold on the screen to move the bar chart around. Turning it and making it bigger or smaller. The chart on the right shows a list of the items in the report, then corresponding color, and the sales amount.
Line: Shows the report in a line chart. The bottom two buttons offer different views of the line chart. The left button scrolls form tube, tape, and line. The right button will show the line chart either in a jagged style or a step style . While viewing the line chart , click and hold on the screen to move the line chart around. Turning it and making it bigger or smaller. The chart on the right shows a list of the items in the report, then corresponding color, and the sales amount.
The four icons on the bottom will export the report to that type of program. The programs must be installed on the computer in order for them to be exported. The order of the icons is as follows: Excel, Adobe Acrobat, Note Pad, and Word Pad.